Turnover doesn’t usually announce itself. You feel it in missed deadlines, repeated backfills, and quiet exits that catch you off guard. By the time leadership starts asking why retention is dipping, the trend is already well underway.
As of May 2025, the average monthly turnover rate across U.S. industries is 3.3%, according to the U.S. Bureau of Labor Statistics.
But that number means little without context. What’s normal for a government agency could be a major red flag for a fast-moving tech company.
That’s why you need to calculate turnover rate accurately and segment it by department, tenure, and exit type. It gives you early visibility into what’s really happening inside your teams.
In this blog, we’ll walk through how to calculate turnover rate step by step, what your number actually tells you, and how to use it to reduce avoidable exits before they become business risks.
Key Takeaways:
- Turnover rate is a signal of where your processes, onboarding, or role design might be failing.
- Calculating turnover is simple, but its value comes from how you segment and analyze it across teams, roles, and exit types.
- A “good” turnover rate depends on your industry, organizational model, and the kind of attrition that actually impacts your business.
- Early warning signs like repeat backfills, vague exit feedback, or falling tenure often show up before the metric does.
- Fixing turnover means improving clarity, accountability, and career growth, not just chasing engagement scores.
What is the Employee Turnover Rate?
Employee turnover rate measures how often people leave your company over a set period of time. It’s one of the simplest ways to gauge workforce stability, and when tracked right, a key input for fixing what’s not working.
In simple terms, it’s the percentage of employees who exit during a set timeframe, typically monthly, quarterly, or annually.
Turnover includes both:
- Voluntary exits: Resignations, career changes, better offers, etc.
- Involuntary exits: Layoffs, terminations, or performance-related exits.
However, it’s not entirely about counting exits. When segmented correctly, turnover tells you where the employee experience is breaking down — whether that’s post-onboarding, within specific teams, or after a particular tenure mark.
You need to look at:
- How many people left in a given period
- How many exits were voluntary vs. involuntary
- Average tenure of those who left
- Roles or departments showing repeat churn
This data helps you spot operational issues before they become systemic.
High early attrition might mean misaligned role expectations. Department churn could point to poor management or team dynamics. The point is to catch the trend before it becomes the norm.
How to Calculate Turnover Rate (Step-by-Step)
The formula is simple on paper. But what you do with it is what drives real impact.

Here’s how to calculate it properly:
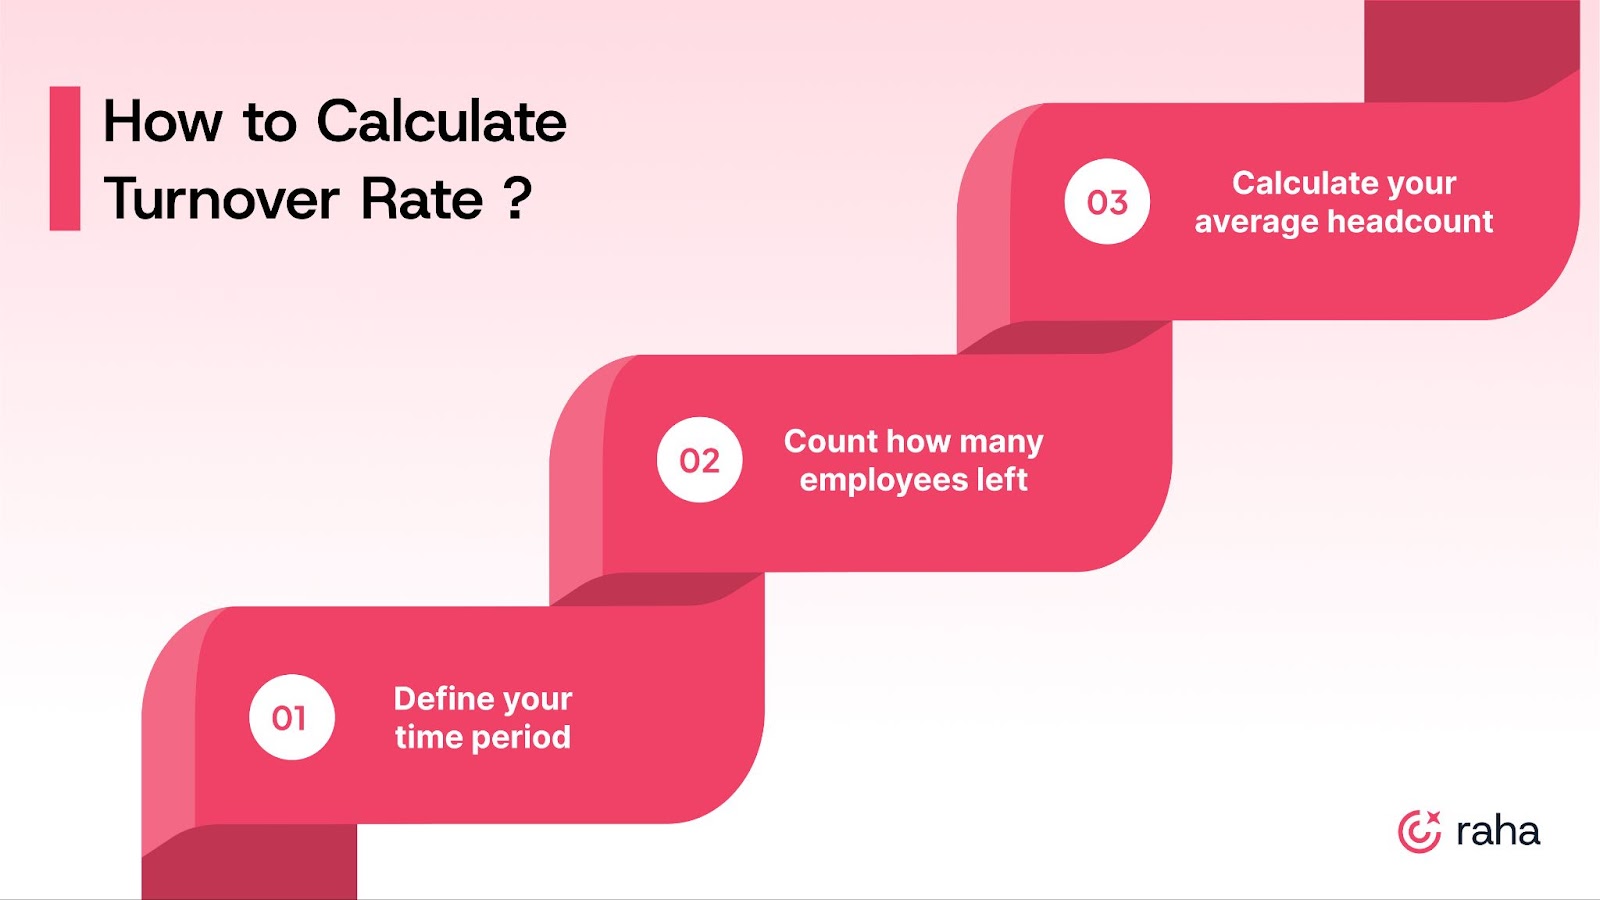
Step 1: Define your time period
Choose a consistent timeframe: monthly, quarterly, or annually. The key is to track it the same way each time, so trends are easy to spot.
Step 2: Count how many employees left
Include both voluntary and involuntary exits, depending on what you’re measuring. If you're trying to improve retention, include both. If you're focused on cultural fit or hiring quality, you might isolate just voluntary exits.
Step 3: Calculate your average headcount
Use this formula:
(Starting Headcount + Ending Headcount) ÷ 2
Step 4: Plug in the numbers
Example:
- Employees who left in Q1: 10
- Starting headcount: 120
- Ending headcount: 130
- Average headcount: (120 + 130) ÷ 2 = 125
- Turnover Rate = (10 ÷ 125) × 100 = 8%
This gives you a clear, baseline metric you can segment further by department, role, or manager to find where attrition is really coming from.
What’s a Good Turnover Rate?
There’s no single number that defines a healthy turnover rate. What’s considered high in one industry might be completely normal in another. That’s why tracking turnover in isolation won’t help; you need to benchmark it against your industry and role type.
Here’s what average monthly turnover looks like across major U.S. industries in 2025:
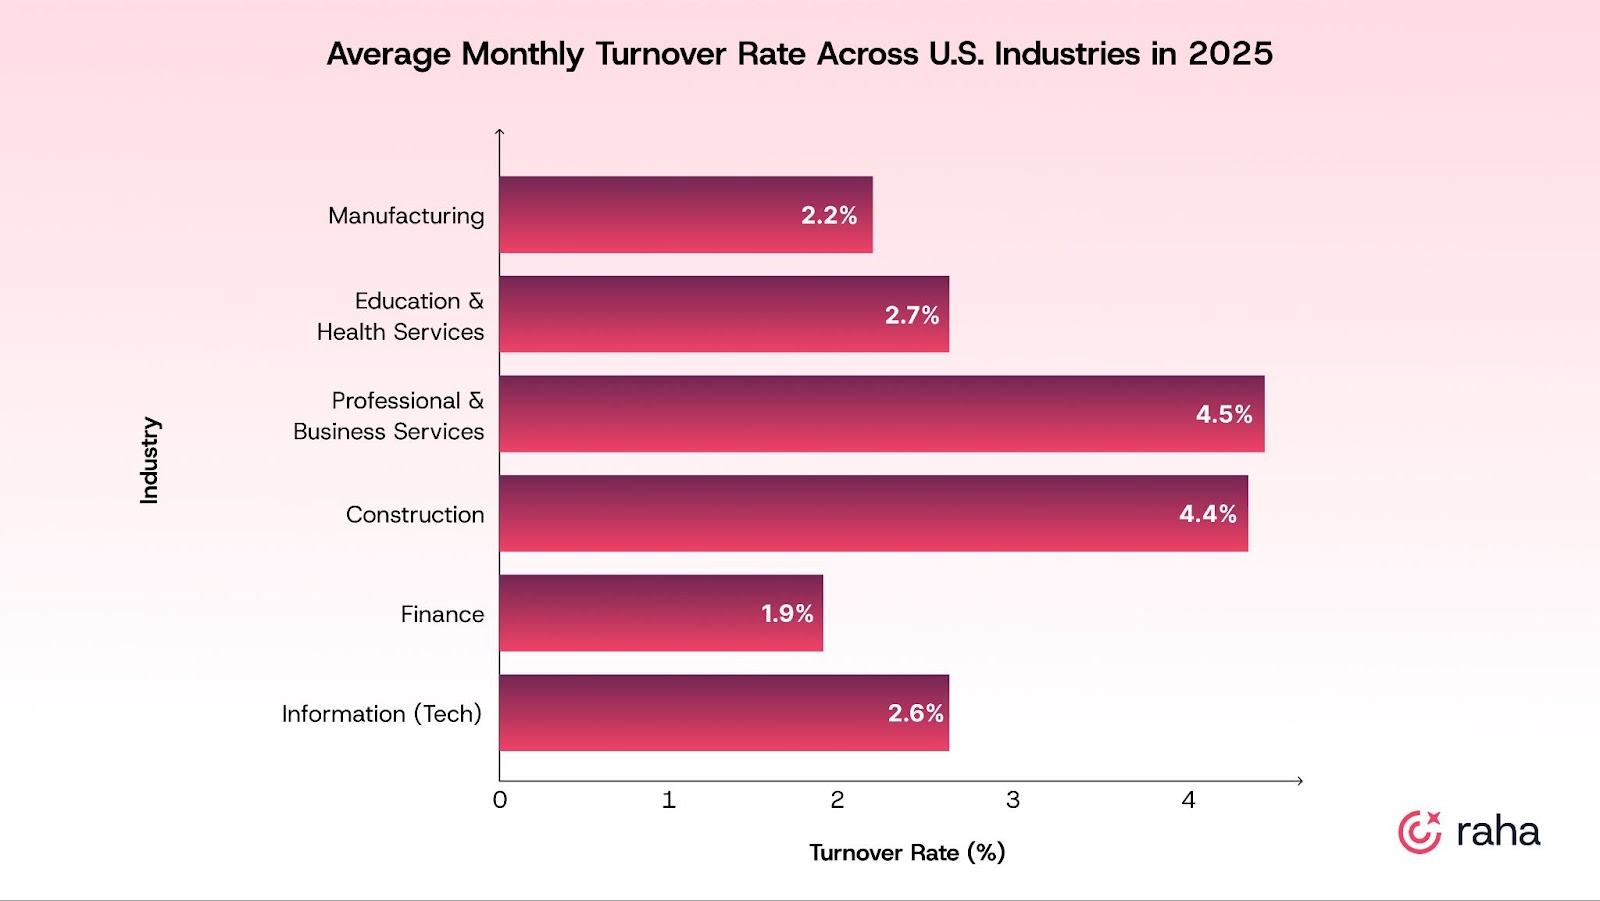
Source: U.S. Bureau of Labor Statistics (BLS), May 2025
What’s “good” depends on two things: what’s typical for your industry and what’s sustainable for your team and business goals. If you're in a high-churn field like retail, your goal isn't to match government stability. It's to reduce regrettable attrition, the kind that hurts productivity, morale, and hiring costs.
Also read: Average Employee Turnover Rates by Industry 2025
How to Know Your Turnover Rate Is Becoming a Problem
You don’t need a dashboard to tell you retention is slipping. It shows up in your day-to-day operations before it becomes a metric.
A top performer leaves before launch. You’re short-staffed mid-project. You’ve filled the same role three times this year.
Here’s what to watch for:
- You’re refilling the same role repeatedly: Recurring exits in the same function usually point to a structural issue. Either the role isn’t scoped properly, onboarding isn’t landing, or the manager isn’t setting people up to succeed.
- Exit feedback is vague or overly polite: When people say, “It was just time for a change,” that’s often code for unresolved problems. If you keep hearing the same non-answers, there’s something underneath that needs fixing.
- Tenure is dropping below a year: If employees are leaving before hitting 12 months, something is going wrong early. It could be misaligned expectations, weak onboarding, or poor manager support.
- Engagement dips before resignations: People rarely leave overnight. If you’re seeing a drop in participation, missed deadlines, or silence in 1:1s, those are early warning signs.
- New hires say the role isn’t what they expected: This starts at intake. If the job sounds one way in interviews but plays out differently on the team, there’s a trust issue. Misaligned role expectations drive quick exits.
- You’re always reacting, not anticipating: If every resignation feels like a surprise, you’re flying blind. Stay interviews and regular pulse checks help you surface concerns before they become attrition.
- One team always has high churn: If one department consistently loses people, it’s not a coincidence. Look deeper into the leadership, workload, growth opportunities, or team culture. Something in the experience is pushing people out.
Turnover builds slowly and quietly until it becomes expensive and hard to reverse. Spot the signals early and fix the root cause.
How Can You Reduce Employee Turnover
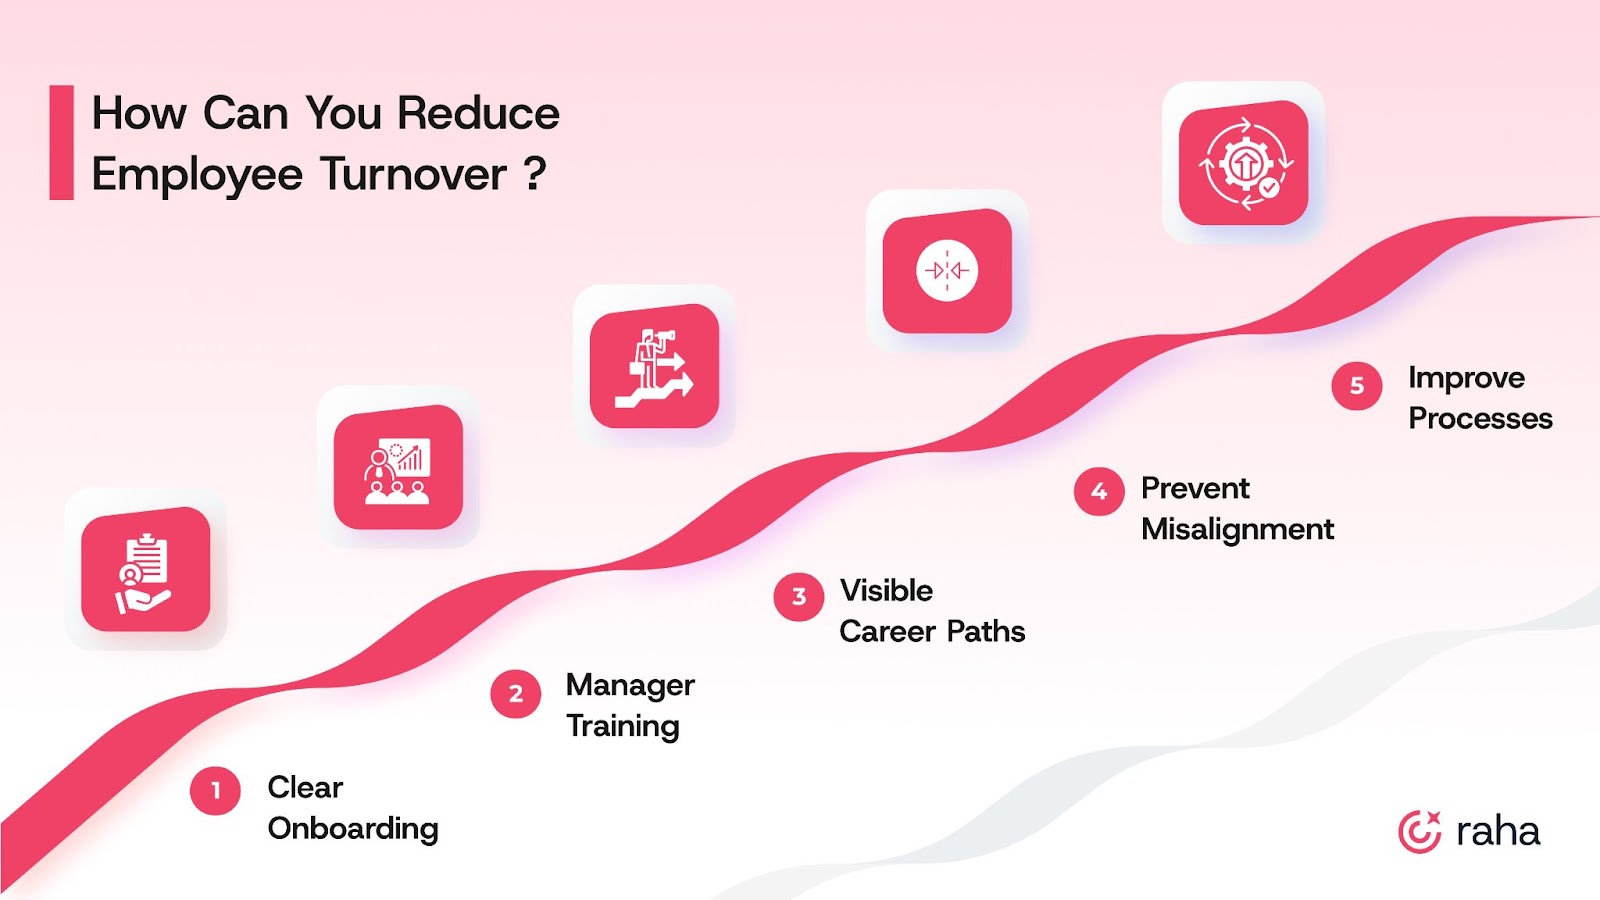
Once you know where attrition is happening, the next step is fixing the root cause. Here’s what experienced teams focus on:
1. Start with Stronger Onboarding and Role Clarity
Build structured 30-60-90 day plans that include clear deliverables, manager check-ins, and real team integration. Audit your job descriptions and interview pitch to make sure they match the actual day-to-day. The goal is to eliminate surprises from day one.
What it improves:
- Lowers 90-day attrition
- Boosts time-to-productivity
- Builds early trust with new hires
2. Train Managers to Retain
Invest in real, practical management training. Focus on how to run effective 1:1s, deliver feedback, and create psychological safety. Use skip-level meetings and pulse surveys to flag early friction.
What it improves:
- Increases team engagement
- Reduces voluntary exits
- Improves manager effectiveness scores
3. Build Career Paths Employees Can See and Use
Make growth visible and structured. Create role progression frameworks. Schedule development check-ins quarterly. Offer stretch projects before promotions are available.
What it improves:
- Average tenure
- Boosts internal mobility rate
- Reduces the exit rate among high performers
4. Spot Misalignment Before It Becomes Attrition
Use structured interviews and calibrate across the team. Collect feedback right after the offer stage or during onboarding to catch red flags early. Stay interviews are also key to understanding what might be pushing good people to consider leaving.
What it improves:
- Reduces early-stage churn
- Increases candidate-to-role match quality
- Improves candidate experience scores
How Can Raha AI Help?
Raha AI eliminates expectation gaps from the start. It’s an AI recruiter that helps teams align on the role early, screen consistently, and keep candidate messaging tight. It offers:
- AI Resume Screener: Pulls structured data from resumes, scores candidates for role fit, and flags those who actually match the job requirements. So your shortlists reflect the role as it is.
- AI Interviewer: Runs the first-round call using JD-specific questions and captures structured insights in a full candidate report. Every candidate hears the same pitch, so expectations stay aligned throughout the funnel.
5. Fix the Process, Not Just the People
Treat turnover as a process metric, not just a people issue. Look at time-to-promotion, team workload, and how long it takes to address feedback. Review hiring pipelines for gaps between promise and delivery.
What it improves:
- Increases retention across historically high-churn teams
- Boosts trust in leadership
- Turns passive attrition data into active improvements
Also read: How AI Candidate Screening Speeds Up Hiring and Improves Fit
Stop Turnover Where It Starts
Once you know how to calculate turnover rate, you can stop guessing and start diagnosing. And more often than not, the root cause is your process.
Turnover builds from vague expectations, rushed interviews, and onboarding that never quite lands. By the time it shows up in your metrics, it’s already cost you time, budget, and team trust.
Raha AI helps you catch those gaps before they turn into exits.
It acts like an extension of your team, screening resumes with real role-fit logic, running consistent first-round interviews, and keeping your process moving without all the manual lift.
See how Raha AI helps you hire better, faster, and with less fallout.
FAQs
1. What is the difference between turnover rate and attrition rate?
Turnover rate includes all exits, whether roles are backfilled or not. Attrition typically refers to permanent reductions in headcount when a role is not refilled. Both signal employee loss, but turnover tracks operational stability while attrition may indicate downsizing.
2. What is the formula for turnover rate?
Turnover Rate (%) = (Number of Employees Who Left ÷ Average Number of Employees) × 100
This gives you the percentage of employees who exited during a specific period, helping you track retention trends over time.
3. What does a 20% turnover rate mean?
It means 20% of your workforce left the company during the period you’re measuring (usually a year). For example, if you had an average of 100 employees and 20 exited, your turnover rate is 20%. Whether that’s “high” depends on your industry, role type, and whether the exits were voluntary or not.
4. How often should I calculate the turnover rate?
Monthly or quarterly is ideal if you're tracking trends or running experiments (like onboarding changes). Annual views work for strategic planning, but they often miss short-term patterns and early warning signs.
