Recruiting runs on numbers. You need to know how many candidates enter the funnel, where they drop off, and how long each stage takes. You need to know what it costs to hire and how quality holds up over time.
To improve hiring outcomes, you don’t need more data. You need the right data. KPIs bring structure to hiring. They create visibility into how your funnel performs, where candidates drop off, how long it takes to make decisions, and what each hire costs. More importantly, they help recruiting stay accountable to itself, to hiring managers, and to leadership.
This guide covers 11 core KPIs in the recruitment industry that experienced teams use to measure performance, identify bottlenecks, and align recruiting with business goals.
Why KPIs Matter in the Recruitment Industry?
Hiring breaks quietly. You don’t always see it in missed headcount targets or delayed onboardings. Sometimes it’s slower: pipeline quality dips, offer declines creep up, interview loops get bloated, or hiring managers lose confidence in the process. By the time someone flags it, you've already lost time, budget, and trust.
That’s why real recruiting teams track Key Performance Indicators (KPIs). Not to look good on a dashboard, but to know—in real time—where the system is underperforming.
An experienced recruiter doesn’t just want volume; they want conversion. They want to know:
- Which sources bring in high-signal candidates
- Where top talent is dropping off
- How long decisions take and who’s slowing them down
- How offer acceptance varies across teams, roles, and comp bands
These metrics act as levers, helping you identify what’s dragging your speed or quality. But are all KPIs important? And what should you track? Let’s find out.
Must read: Artificial Intelligence in HR: Use Cases and Key Benefits
There’s no shortage of metrics in recruiting. You can track everything from pipeline velocity to time-in-stage to rejection reasons. But more data doesn’t mean better decisions. What matters is choosing the KPIs that tell you something actionable, in your context.
What you track should be shaped by your constraints. Are you hiring for volume or complexity? Do you need speed, or are you protecting quality? Are hiring managers aligned, or do you need tighter process control?
Before locking in KPIs, consider:
- Stage of growth: Early teams focus on speed and output (Time to Hire, Offer Acceptance). Mature orgs need more efficiency and cost visibility.
- Org complexity: More functions = more handoffs. Track conversion and time-in-stage to catch process drag.
- Current bottlenecks: Let pain points guide your metrics. High decline rates? Track rejection reasons. Stalled pipelines? Measure feedback loops.
- Team capacity: KPIs should also reflect recruiter and HM load. Interview ratios, req load, and latency help surface resourcing issues early.
Once you have an understanding of the above, you can finalise what metrics you want to track and improve. Here’s a list of our top 11.
1. Cost per Hire
Cost per hire calculates how much it costs to recruit a new employee, factoring in things like advertising, agency fees, and recruiter salaries. This KPI tells you whether you’re overspending, especially if you're depending too heavily on pricey agencies or ineffective job boards.
Most teams calculate it like this:
Cost per Hire = Total Recruiting Costs / Number of Hires
Here, total recruiting costs typically include:
- Advertising costs (job board fees, paid social media ads)
- Agency fees (if you use external recruiters or staffing agencies)
- Recruiter salaries and bonuses (including internal HR team time)
- Technology costs (ATS, interview scheduling tools, etc.)
- Candidate travel expenses (if reimbursed for interviews)
Say you spend $20,000 in a quarter and make five hires. That’s $4,000 per hire.
But the real insight comes from slicing the data.
- What’s your cost per hire by channel? By role type?
- Are you spending more to land your best hires, or just spending more?
2. Time to Hire
Time to Hire is often mistaken for a sourcing issue. However, in most cases, the real drag occurs after the first interview, when resume reviews sit idle for days, or interview panels struggle to align on a time slot.
These delays compound quickly. Tracking the full cycle is helpful. But what matters more is breaking it down:
- How long from the first outreach to the screen?
- From the final round to offer?
- From offer to acceptance?
That’s how you spot patterns and fix them. One team might lose five days waiting for panel feedback. Another might be stuck in a weekly hiring committee that only meets on Fridays.
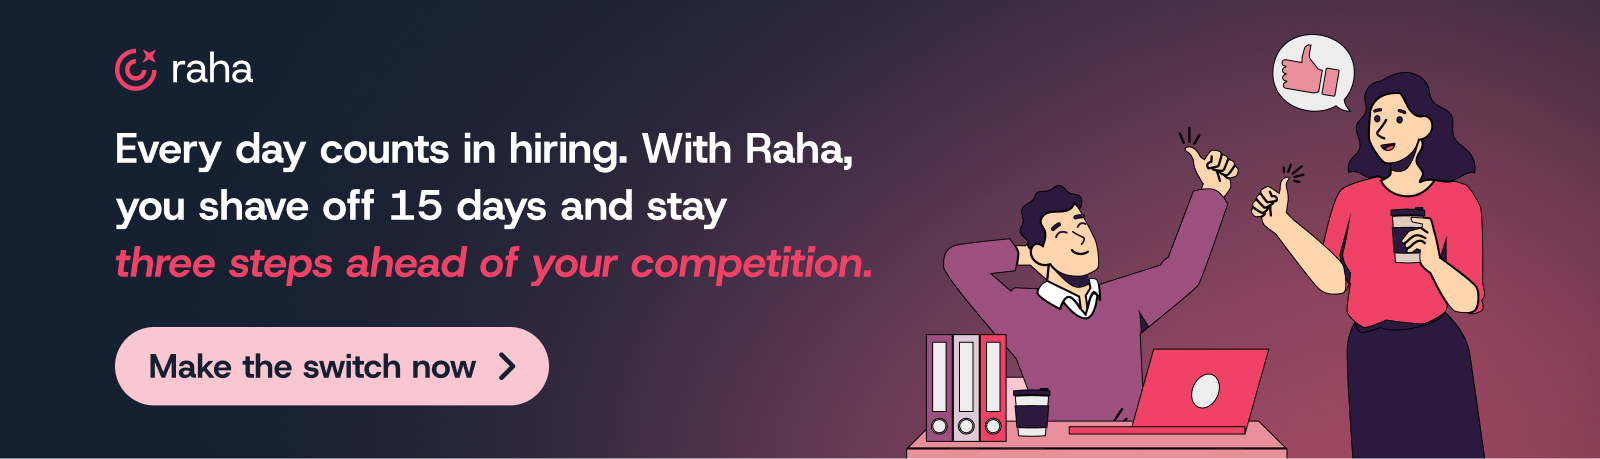
With Raha AI, teams are reducing time-to-hire by up to 15 days, thanks to built-in automation. Here’s how Raha speeds it up:
- AI Resume Screener pulls key details from resumes, applies filters, matches them against the JD, and assigns fit scores so recruiters can shortlist in minutes.
- AI Interviewer handles the first-round fit check through phone and video interviews. It uses custom or JD-based questions, then generates reports for each candidate.
- AI Interview Coordinator manages the full interview schedule, syncing calendars, collecting availabilities, following up, and rescheduling when needed.
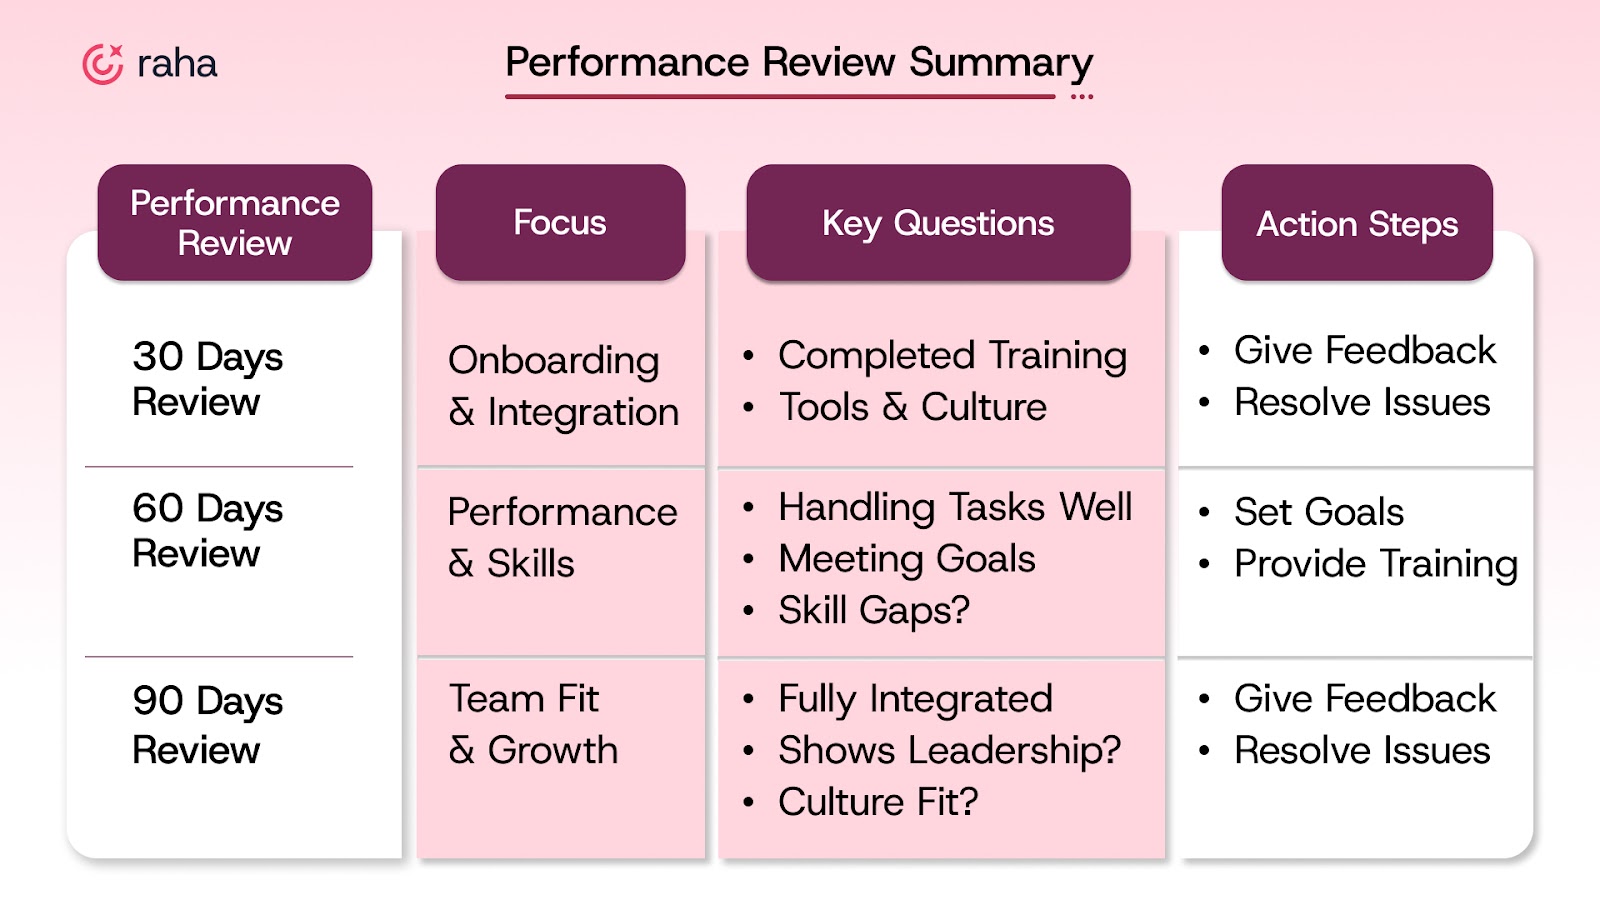
3. Quality of Hire
Time and cost only tell part of the story. Quality of hire shows whether your process is actually working, whether your hires perform, stick around, and contribute.
It’s not the easiest metric to define, which is why so many teams skip it. But experienced recruiters build simple frameworks that make it measurable.
One of the most reliable ways to track quality is through a structured 30-60-90 day review. It surfaces early warning signs, tracks contributions over time, and gives hiring managers a shared baseline for evaluation.
You can use the framework below to gain a clear understanding of whether your hiring decisions are positioning the business and the candidate for success.
4. Candidate Sourcing Channels
Organizations utilizing AI-driven recruitment solutions have experienced a 25% reduction in the average time to fill positions compared to those relying on traditional methods. Candidate sourcing channels measure where your candidates are coming from, such as job boards, LinkedIn, referrals, etc.
Tracking sourcing channels shows you which platforms are truly working and which ones are draining your budget with little return. Sourcing is all about efficiency. If you’re investing in channels that don’t bring in quality candidates, cut the ties. Focus your energy on what delivers.
5. Candidate Satisfaction
This KPI measures how candidates feel about their experience throughout your recruitment process. A positive candidate experience is everything in today’s competitive hiring market. If candidates have a bad experience with your process, whether it’s long delays, poor communication, or a confusing interview, word gets around, and it’ll hurt your employer brand.
A strong candidate's experiences also have a positive connection with long-term employee experiences and satisfaction, as candidates with an exceptional candidate experience are 3.2 times as likely to strongly agree they are connected to their organization’s culture and three times as likely to be extremely satisfied with their work.
Here’s a sample candidate satisfaction survey template:
Candidate Satisfaction Survey
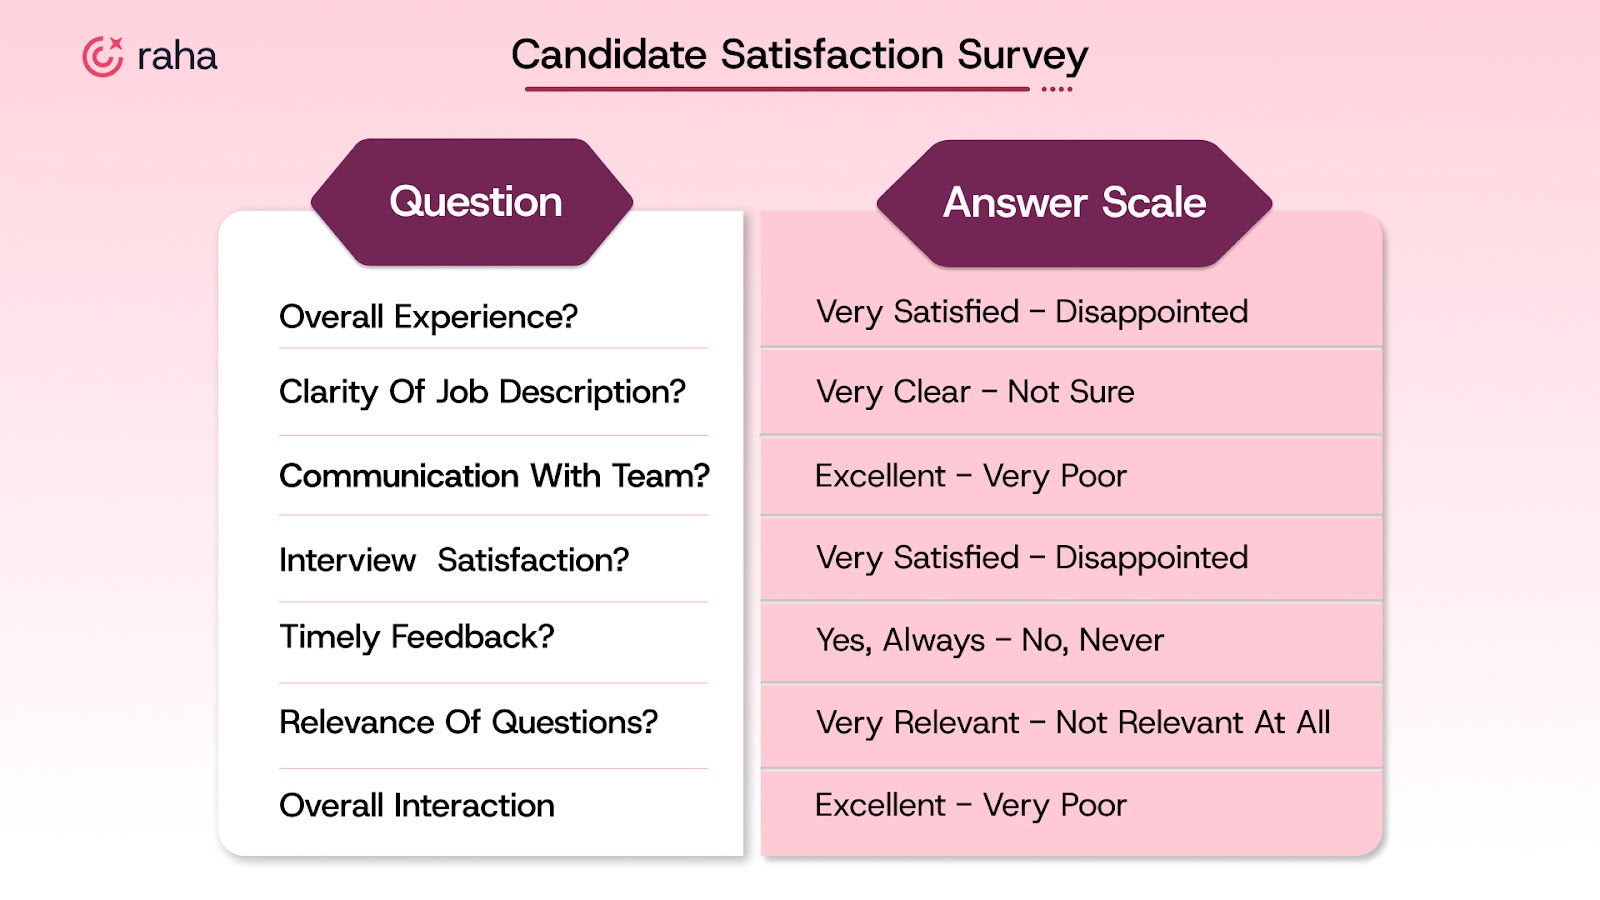
Thank you for participating in our recruitment process! We value your feedback and would appreciate your honest thoughts on your experience.
6. Offer Acceptance Rate
You’ve done the sourcing, run the interviews, and aligned the panel. But if your offer gets declined, none of it matters.
A low acceptance rate is often a signal that expectations were misaligned from the start, on role clarity, timelines, or even team dynamics. Sometimes it’s slow follow-ups. Sometimes it’s offer fatigue after too many interview rounds.
On the other hand, high acceptance rates typically indicate that your process effectively sets candidates up with the right context and reasons to say yes.
What you should track:
- Time from final round to offer letter
- Drop-off reasons (comp, location, role fit)
- Win rate by recruiter or hiring manager
And make sure you’re closing the loop. Every rejected offer is a data point. Treat it like one.

7. First-Year Attrition
First-year attrition measures how many new hires leave the company within their first year. If your first-year attrition rate is high, it’s a massive red flag.
It usually points to one of two things: a mismatch in expectations during hiring, or a broken handoff into onboarding. Either way, it results in lost productivity, team disruption, and another restart on the same role.
According to recent data, approximately 28% of employees leave within their first three months. If your attrition rate is near or above this threshold, it’s important to investigate underlying causes.
Key areas to track:
- Attrition by role type and hiring manager
- Voluntary versus involuntary exits
- Patterns in exit reasons gathered during offboarding
30-60-90 day check-ins can serve as early indicators of risk. Most attrition is preceded by disengagement, which can often be addressed if caught early.
8. Hiring Manager Satisfaction
This KPI tracks how hiring managers feel about the candidates they’re seeing and the process behind it. When there’s alignment, things like interview decisions, feedback loops, and final approvals move faster. When there are not, delays stack up quickly.
Research shows the gap clearly: 57% of recruiters say hiring managers don’t understand recruiting, while 63% of hiring managers say recruiters don’t understand the roles. This disconnect makes it critical to measure satisfaction, identify friction points, and course-correct early.
What you can do:
A structured way to bridge the gap is to implement Service Level Agreements (SLAs) with hiring managers. These SLAs define expected timelines and responsibilities, helping to prevent bottlenecks such as delayed resume reviews or offer approvals.
Example SLA Elements:
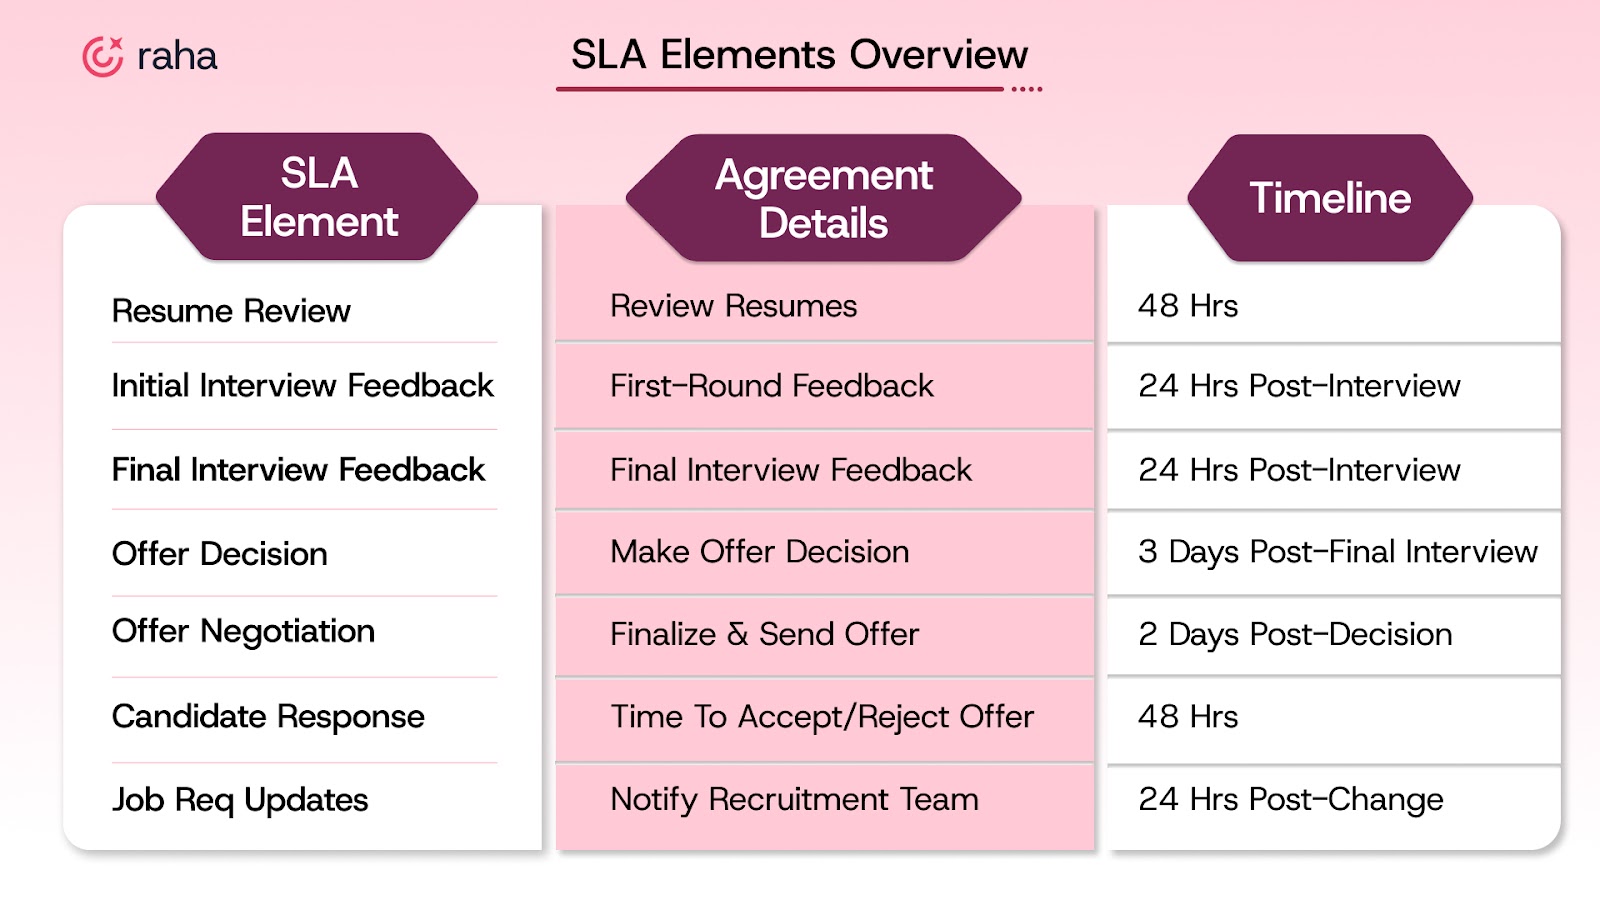
These agreements work best when reviewed quarterly and adjusted based on hiring urgency or team bandwidth.
9. Interview-to-Offer Ratio
The interview-to-offer ratio tracks how many interviews it takes to extend a job offer. A high interview-to-offer ratio typically indicates that either you’re not vetting candidates thoroughly enough before bringing them in or that your interviews are a poor indicator of future performance. The lower this ratio, the more effective your screening process is.
What helps tighten this ratio:
- Pre-alignment with hiring managers on must-haves vs. nice-to-haves.
- Upfront screening for compensation expectations and notice periods.
- Structured interviews that evaluate real job outcomes.
- Using tools (e.g., assessments or take-home projects) to weed out poor fits early.
Pre-screening is your first line of defense. If you don’t get this part right, you're setting yourself up for disappointment later in the process.

10. Diversity Hiring Metrics
Diversity metrics track who’s making it through your funnel, and where they’re dropping off. It’s about spotting patterns and making sure your process isn’t unintentionally weeding out good candidates.
The strongest recruiters don’t just track overall diversity. They go deeper:
- Are your job descriptions attracting a balanced slate?
- Are diverse candidates progressing past initial screens?
- Are certain panels consistently rejecting underrepresented groups?
You already know the business case. Diverse teams perform better and stay longer. What matters is using your data to make better decisions. Check your sourcing, evaluate your panels, and most importantly, build a process where every strong candidate gets a fair shot.
11. Retention Rate
Retention rate tells you if your hires are staying for the long haul. If they’re sticking around, it’s a sign your process is working — the role was clear, the fit was right, and the onboarding didn’t miss.
When retention drops, it’s often not because of the employee. It’s usually something upstream:
- Misaligned expectations
- Rushed screening
- A role that was never scoped properly
Track it by role, source, and manager. That’s where the real insights show up. If you're not keeping an eye on retention, you’re not closing the loop on hiring quality.

Also read: What is Candidate Relationship Management?
Your Final Recruitment Checklist
Tracking KPIs is all about removing friction from your hiring process. Before you close this tab, run through this quick checklist:
- Are you tracking time-to-hire at a granular level, not just start to finish?
- Do you review cost-per-hire by role and channel?
- Is quality of hire based on structured feedback, not gut feel?
- Are hiring managers aligned on SLAs, feedback loops, and decision timelines?
- Do you know your interview-to-offer ratio and why it’s high or low?
- Are your sourcing channels driving ROI, or just draining budget?
- Is your candidate experience being measured and improved, not assumed?
- Do you have a handle on early attrition and long-term retention?
- Is your data helping your recruiters get better, or just sitting in a dashboard?
If too many of those got a “sort of,” it might be time to bring in a smarter partner.
Raha AI is built for teams that want speed without sacrificing quality. It acts like an AI recruiter, automating the heavy lifting so you can focus on strategy. From screening candidates 10x faster to scheduling interviews in minutes, Raha helps you hire 50% faster — and with fewer headaches.
